¶ 1. Overview
The Firm Dashboard in LawPractica gives administrators, partners, and firm managers a comprehensive view of the firm’s operational and financial performance. It consolidates key metrics such as utilization, realization, collections, and revenue trends across all lawyers, helping leadership make informed decisions.
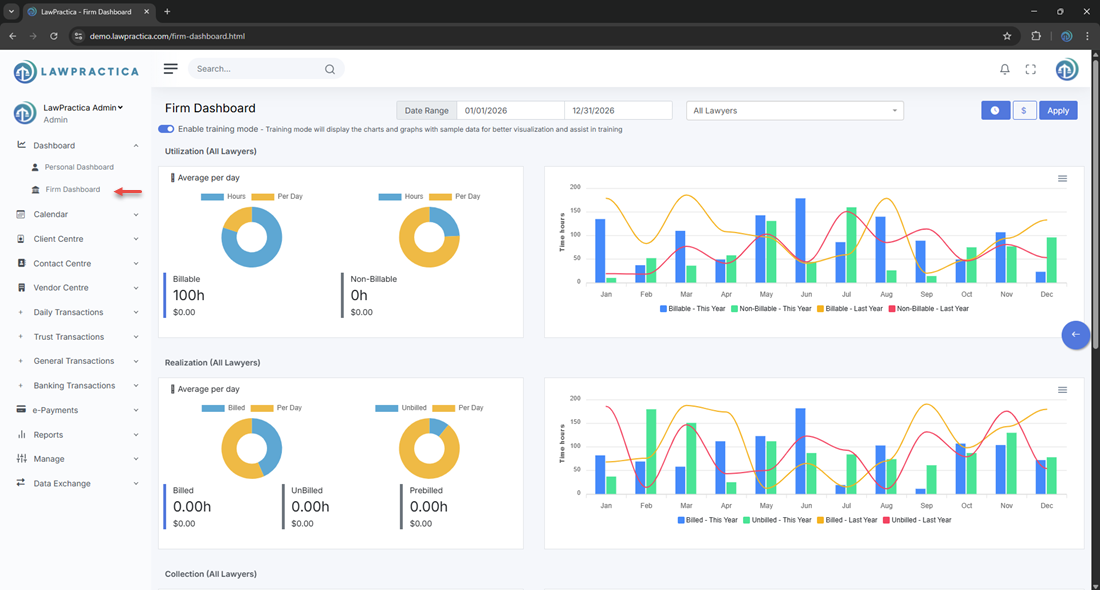
¶ 2. Filters & Date Range
At the top of the dashboard, users can adjust:
- Date Range (e.g., 01/01/2026 – 12/31/2026)
- Lawyer Selection (e.g., All Lawyers)
These filters instantly update all charts and metrics displayed on the page.

¶ 3. Training Mode
A toggle allows users to Enable Training Mode, which displays sample data for demonstration or onboarding purposes. This is useful for training new staff without exposing real firm financials.

¶ 4. Utilization Metrics
The Utilization section shows how many hours lawyers are recording, broken down into:
- Billable hours
- Non‑billable hours
- Average per day
It includes a month‑by‑month comparison of:
- Billable – This Year
- Non‑Billable – This Year
- Billable – Last Year
- Non‑Billable – Last Year
Displayed as a bar chart across all months.
¶ 5. Realization Metrics
The Realization panel tracks how much recorded time is being billed and converted into revenue.
Metrics include:
- Billed hours
- Unbilled hours
- Prebilled hours
- Average per day
Charts compare:
- Billed – This Year
- Unbilled – This Year
- Billed – Last Year
- Unbilled – Last Year
This helps firms understand billing efficiency and workflow bottlenecks.
¶ 6. Collection Metrics
The Collection section shows how much billed work has been paid.
Metrics include:
- Paid
- Unpaid
- Overdue
- Average per day
Charts compare:
- Paid – This Year
- Unpaid – This Year
This helps firms monitor cash flow and outstanding receivables.
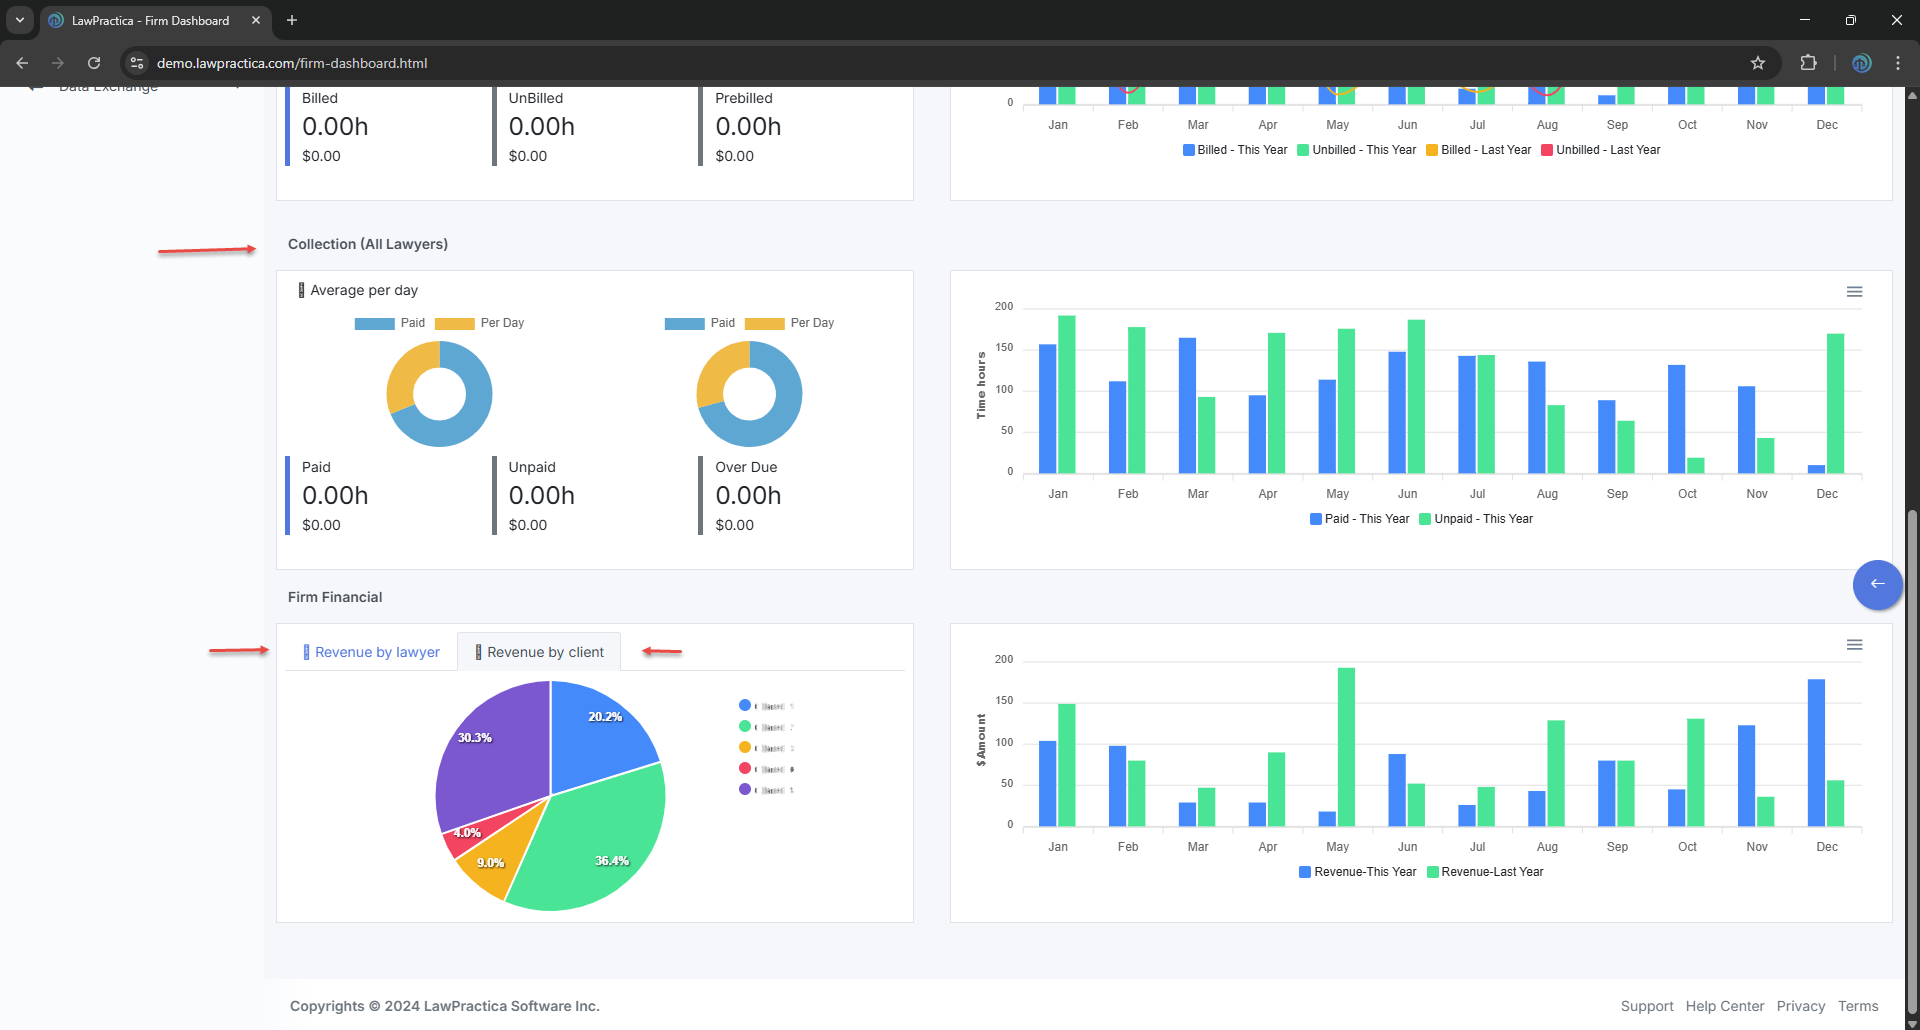
¶ 7. Firm Financials
The Firm Financial section provides a high‑level view of revenue distribution and performance.
¶ A. Revenue by Lawyer
A pie chart shows the percentage of total revenue contributed by each lawyer (e.g., Lawyer A, Lawyer B, Lawyer C, etc.).
¶ B. Revenue by Client
Displays revenue distribution across clients, helping identify top contributors.
¶ C. Revenue Comparison
A bar chart compares:
- Revenue – This Year
- Revenue – Last Year
across all months, giving leadership insight into growth trends and seasonal patterns.
¶ 8. Purpose of the Firm Dashboard
The Firm Dashboard helps law firms:
- Monitor productivity across all lawyers
- Track billed, unbilled, and collected hours
- Identify revenue trends
- Improve financial planning
- Support data‑driven decision‑making
- Maintain transparency across the firm
It serves as the central hub for firm‑wide performance analytics.